Alternating Image & Content Boxes
February 12, 2020Learn More – Related Blog Posts
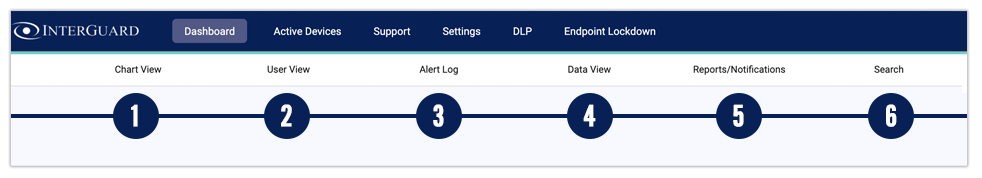
July 8, 20206 Dashboard Views
The Best Employee Monitoring Software Makes Insight Easy
Move from reactive to proactive with your 6 view dashboard
Your Dashboard comes with 6 different views so you can quickly scan through and easily detect trends or issues. We collect lots of data and through our intelligence engine, turn data into information you can use. This way you won't have to constantly hunt and peck through the data to get useful information.
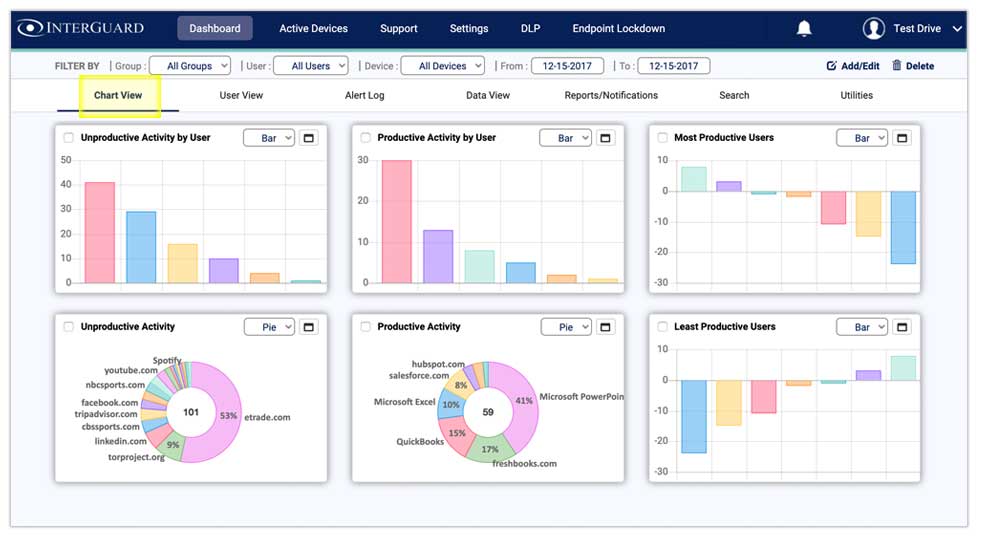
Tab 1: Chart View
Quickly Spot Your Best and Worst Employees
Choose from over 60 pre-set charts to quickly detect trends or issues and if needed drill into the chart for a deeper dive. By default, we’ve pre-selected Productivity charts but you can choose from the ones most interesting to you.
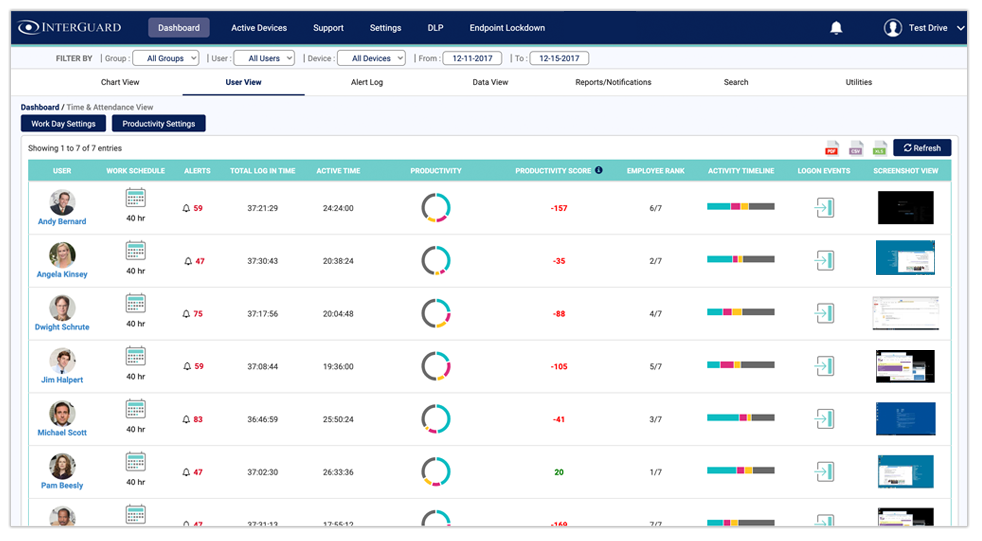
Tab 2: User View
The Easy Way to See How Each Team Member is Doing
The User View lets you quickly scroll through your team members – easily identifying outliers such as most active, least active and highest risk. Drill into any team member for a deeper dive, including screenshots.
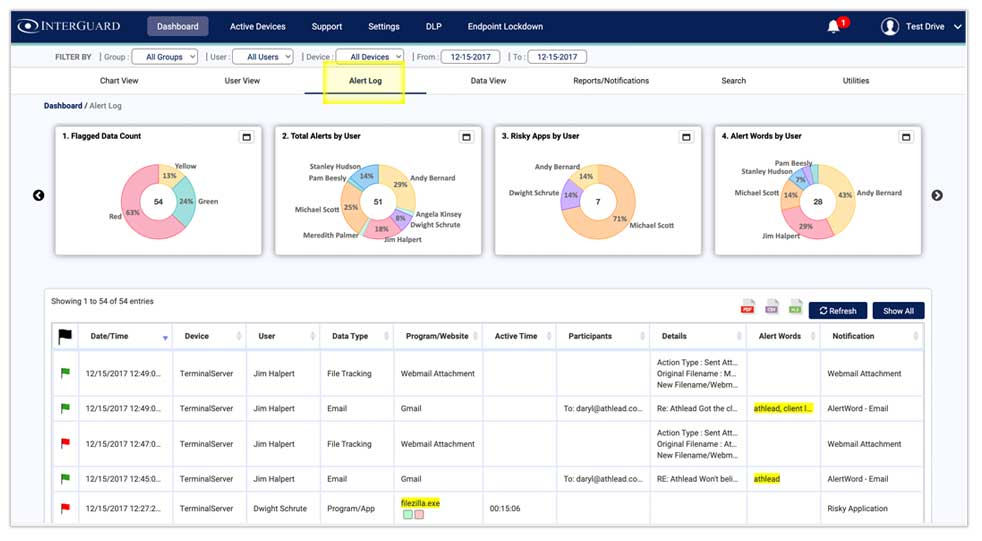
Tab 3: Alert Log
Easily Track and Respond to Issues
Alerts are generated by rules you create. Drill in to see more details, including screenshots. Close alerts or keep them open by changing the flag's color - and attach a note to the alert for future audits.
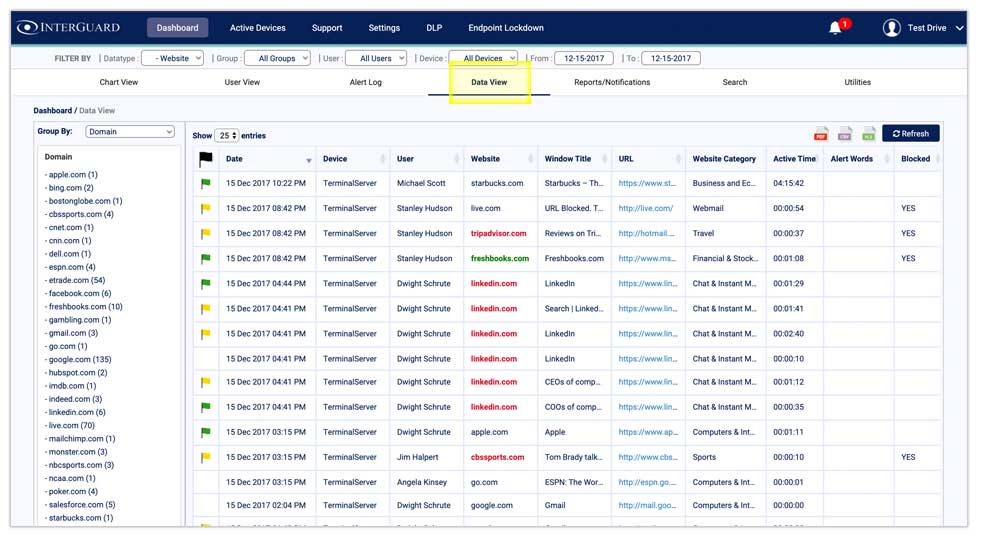
Tab 4: Data View
All the Data, Easily Sortable.
On the Data View, you’ll find a log of all your recorded data. But again – we don’t want you spending time sifting through data in order to understand what’s going on. It’s easy for you to find things with multiple ways to sort and filter.
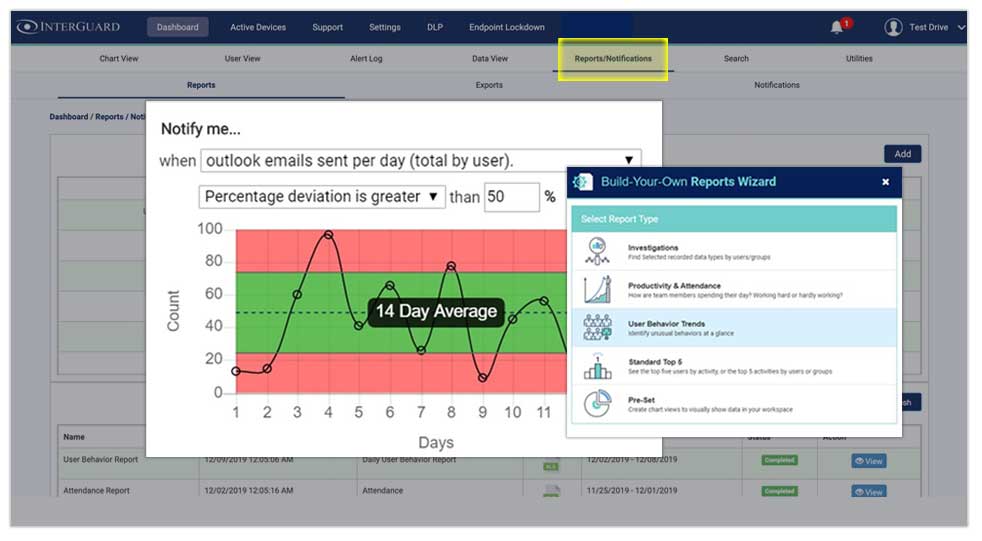
Tab 5: Reports & Notifications
Wizards Make it Easy
It’s easy to create any report or notification you need with a step-by-step wizard. Automatically send reports and notifications (daily, weekly or on-demand) to selected recipients by email , or download them right from this view.
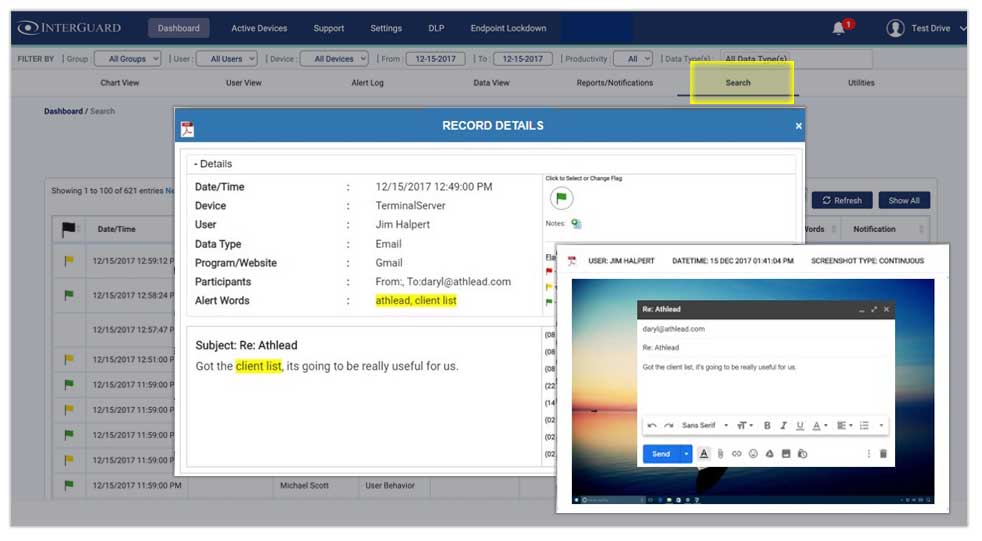
Tab 6: Search View
Easily & Quickly Find Any Activity
Go to the Search View when you are looking for a specific activity – perhaps in the case of an investigation. This powerful keyword-based search will find a needle in your recorded data haystack.